FlowmindeR is a package used for helping produce consistent graphical outputs for Flowminder work in line with branding guidance. It provides sets of themes and helper functions in three categories:
-
Plots: A ggplot style for producing Flowminder graphics for producing graphs in
ggplot - Documents: Templates to produce PDF and HTML documents through R Markdown
- Maps: Convenient links to use Flowminder themed from Mapbox
Installation
FlowmindeR is not on CRAN, so you will have to install it directly from Github using remotes. If you do not have the remotes package installed, you will have to run the first line in the code below as well.
# install.packages('remotes')
remotes::install_github('Flowminder/FlowmindeR')
Plotting
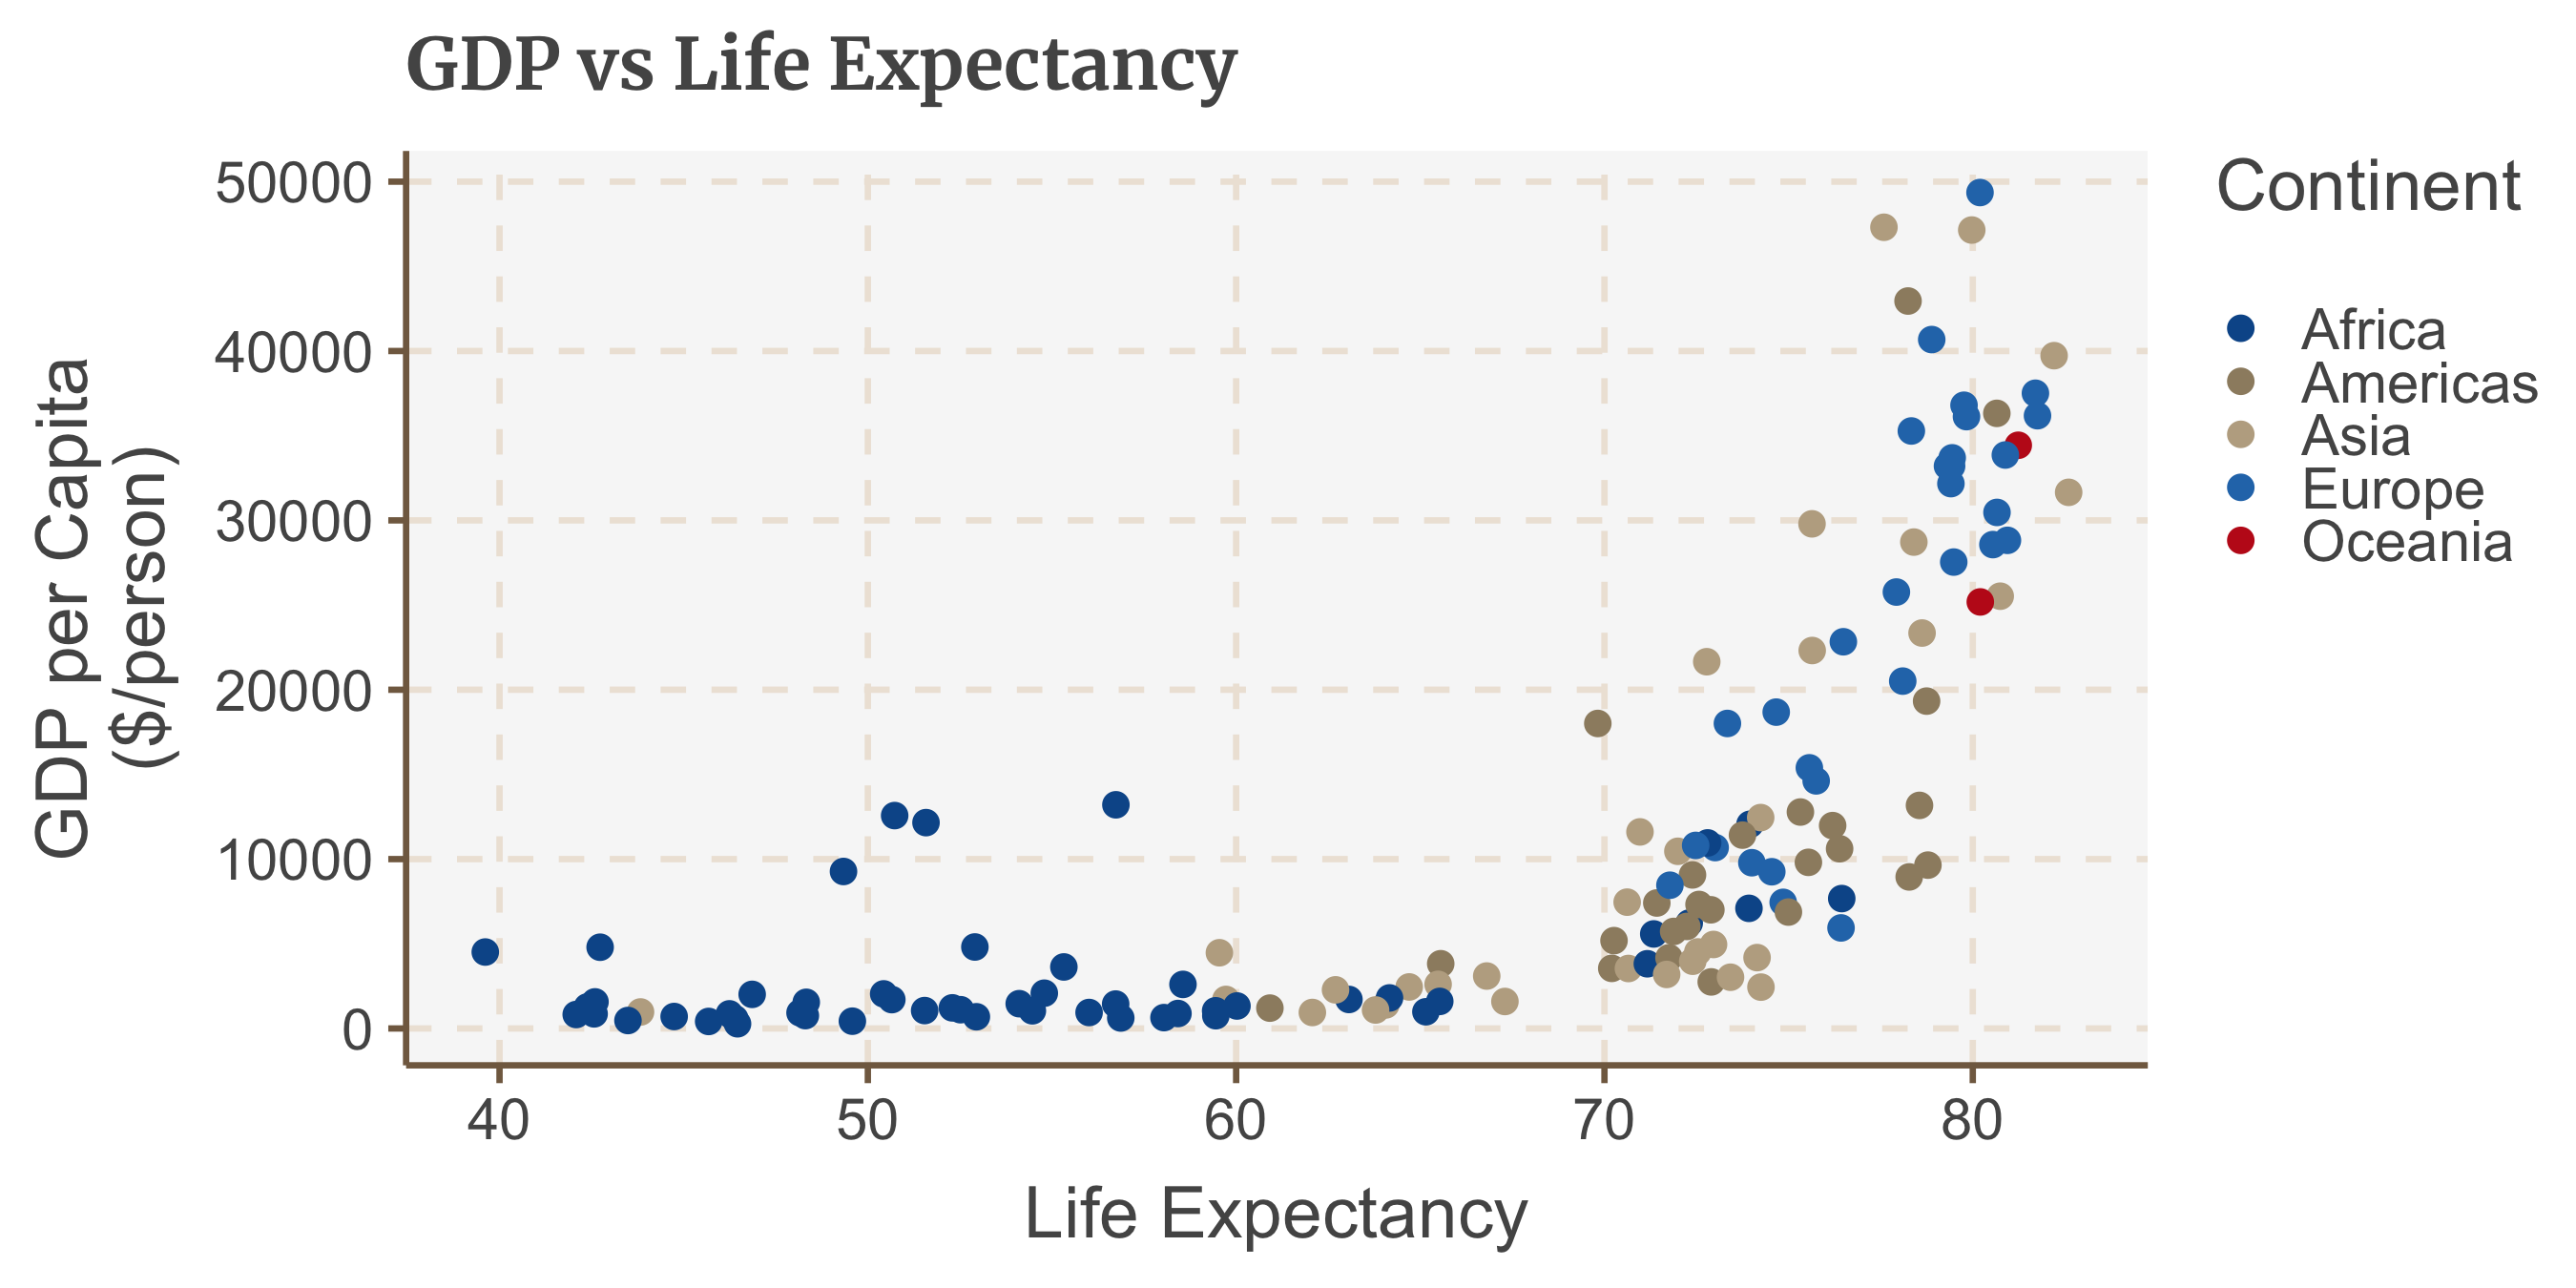
The package helps set a default theme for ggplot graphics. This is set globally for all your analysis through the set_fm_style() function, which has no arguments and used to set the default ggplot themes. This sets text size, font and colour, axis lines, axis text and many other standard chart components into the Flowminder style.
Example of how it is used in a standard workflow:
library(ggplot2)
library(gapminder) # Used as example data
library(tidyverse)
#> ── Attaching packages ────────────────────────────────────────────────────────────────────────────────────────────────────────────── tidyverse 1.3.0 ──
#> ✓ tibble  3.0.3     ✓ dplyr   1.0.0
#> ✓ tidyr   1.1.0     ✓ stringr 1.4.0
#> ✓ readr   1.3.1     ✓ forcats 0.5.0
#> ✓ purrr   0.3.4
#> ── Conflicts ───────────────────────────────────────────────────────────────────────────────────────────────────────────────── tidyverse_conflicts() ──
#> x dplyr::filter() masks stats::filter()
#> x dplyr::lag()    masks stats::lag()

# Set the defaults
set_fm_style()

gapminder_2007 <-
  gapminder %>%
  filter(year == 2007)

ggplot(gapminder_2007, aes(x = lifeExp, y = gdpPercap, colour = continent)) +
  geom_point() +
  labs(x= "Life Expectancy",
       colour = "Continent",
       y = "GDP per Capita\n($/person)",
       title = "GDP vs Life Expectancy")
The function is pretty basic and does not change or adapt based on the type of chart you are making, so in some cases you will need to make additional theme arguments in your ggplot chain if you want to make any additions or changes to the style, for example to add or remove gridlines etc. Detailed examples on how to use the functions included within the FlowmindeR package to produce graphics are included in the full vignettes, as well as a more general reference manual for working with ggplot2.
R Markdown Templates
R Markdown provides a tool which enables you to combine code and written text, much like Jupyter notebooks. However, the power of R Markdown is that it offers much greater flexibility in how the outputted document can be formatted. As such, it is possible to produce fully branded and functioning PDFs and HTML reports directly from your analysis.

The package contains two functions which can be used: fm_pdf and fm_html, which can be used in the output within the document’s YAML settings:
For more information, see the vignette explaining R Markdown
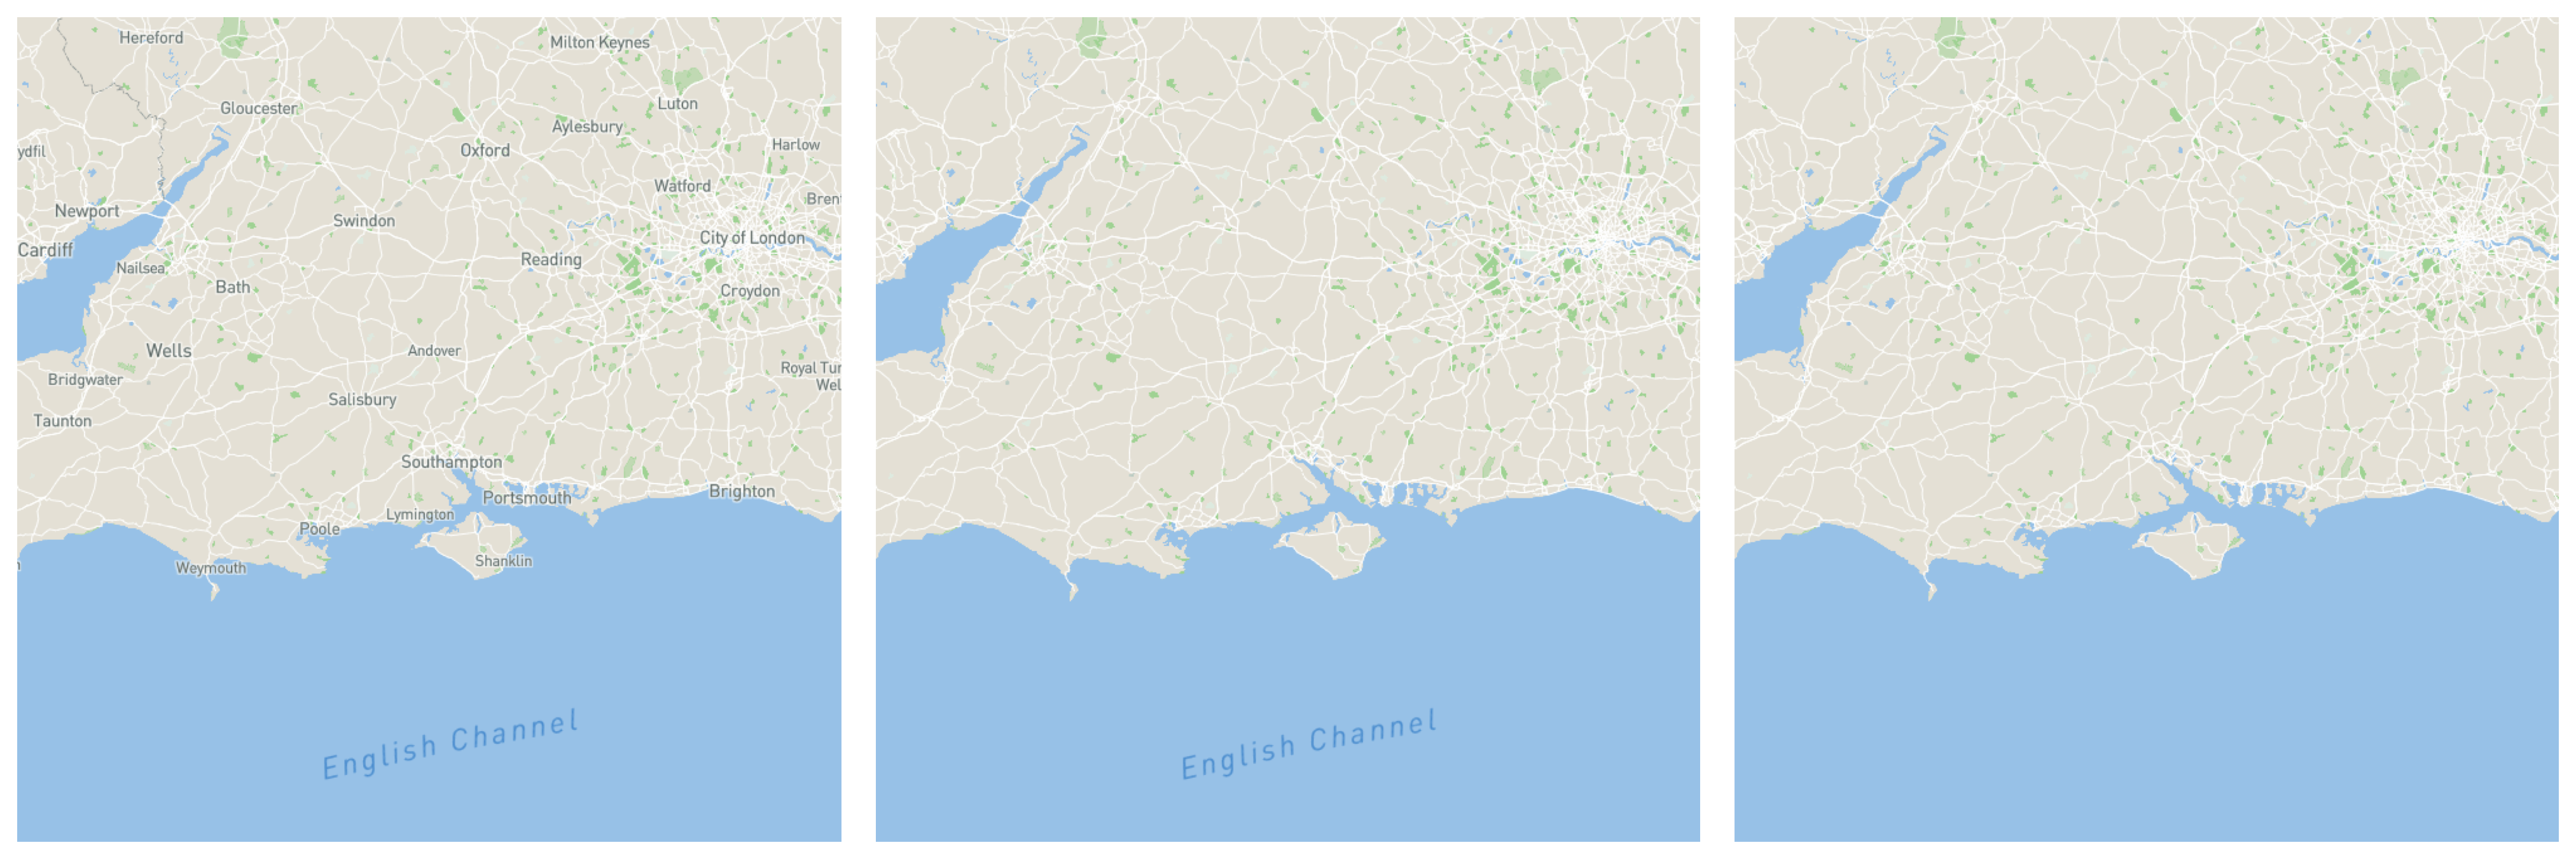
Basemaps
The app offers convenient functions to access custom Mapbox basemaps for plots through the fm_mapbox_styles function. Note, you will have to register with MapBox to get an access key for this functionality to work. For details, refer to the vignette explaining maps