Maps form an important aspect of Flowminder’s work. This section aims to provide general guidance, but specifically explains how these can be implemented in R, spefically highlighting how the tmap package can be used and how custom basemaps can be added.
Setup
The package tmap provides a range of easy to use mapping features. If you want a general introduction to the package, we recommend checking the tmap vignette.
library(tidyverse)
## ── Attaching packages ────────────────────────────────────────────────────────────────────────────────────────────────────────────── tidyverse 1.3.0 ──## ✓ ggplot2 3.3.2 ✓ purrr 0.3.4
## ✓ tibble 3.0.3 ✓ dplyr 1.0.2
## ✓ tidyr 1.1.2 ✓ stringr 1.4.0
## ✓ readr 1.3.1 ✓ forcats 0.5.0## ── Conflicts ───────────────────────────────────────────────────────────────────────────────────────────────────────────────── tidyverse_conflicts() ──
## x dplyr::filter() masks stats::filter()
## x dplyr::lag() masks stats::lag()tmap offers a fairly simple syntax for quickly building maps. It enables static and interactive maps to be produced from the same code. This can be selected by setting tmap_mode("plot") or tmap_mode("view"). Two examples are given below:
# Interactive Graph
tmap_mode("view")
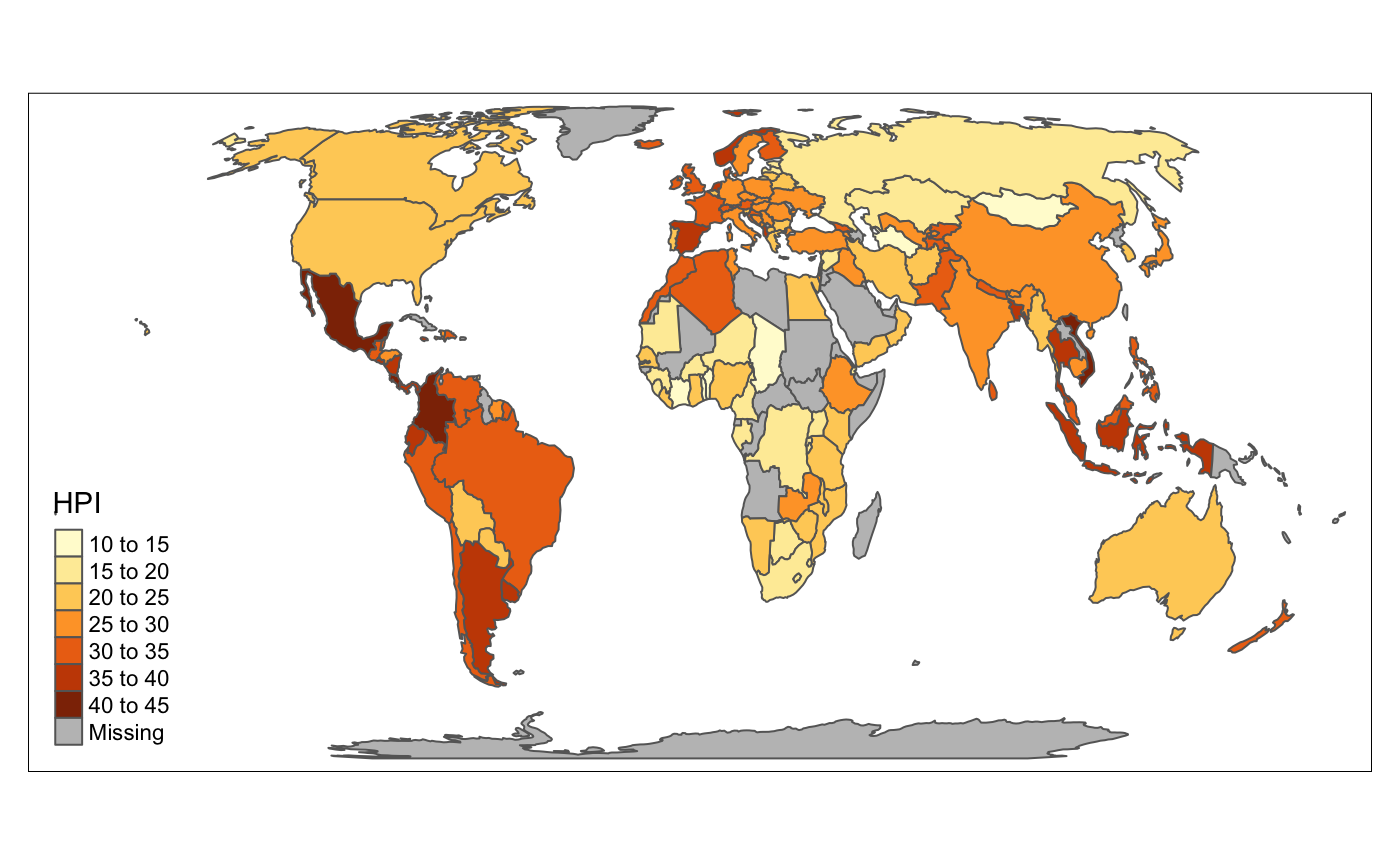
## tmap mode set to interactive viewingdata(World) tm_shape(World) + tm_polygons("HPI", id = "iso_a3", popup.vars = TRUE)
## Linking to GEOS 3.8.1, GDAL 3.1.2, PROJ 7.1.0# Static Graph tmap_mode("plot")
## tmap mode set to plottingdata(World) tm_shape(World) + tm_polygons("HPI")
Adding Basemaps
The ceramic package can be used to add MapBox basemaps to plots. As advised in the package vignettes, when you first install the package, you will have to set the package up to your MapBox API key. You can sign up to a free account at MapBox which provides a generous free tier, and for personal use you should have no problem using this key as much as you need:
install.packages("ceramic")
Sys.setenv(MAPBOX_API_KEY = "<yourkey>")
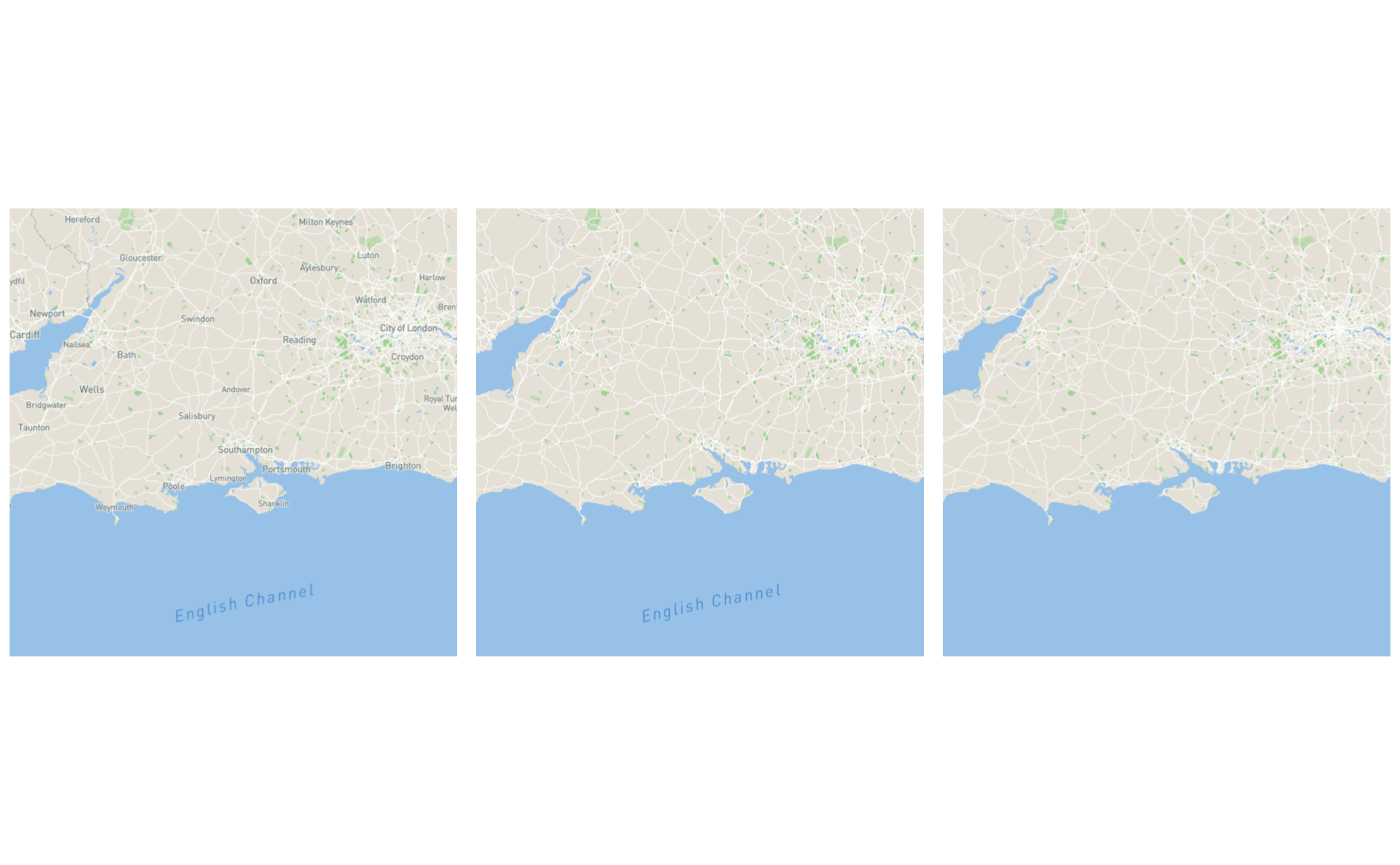
Once installed, you can use the cc_location function to extract basemaps for a given location. This will great a raster of the outputs. To create maps in the required stlye, you can use the base_url function and supply fm_mapbox_styles. Currently, the choices are basic, no borders or no names:
library(ceramic)

basemap1 <-
cc_location(loc = cbind(-1.5, 50.99),  buffer = 2e5,
base_url = fm_mapbox_styles("basic"),
max_tiles = 9)
## Preparing to download: 6 tiles at zoom = 7 from
## https://api.mapbox.com/styles/v1/michaelharper/ck9odvbw20vxv1ilqm5pzzpxf/tiles/512/
## Warning in showSRID(uprojargs, format = "PROJ", multiline = "NO"): Discarded
## ellps unknown in CRS definition: +proj=merc +lon_0=0 +k=1 +x_0=0 +y_0=0
## +R=6378137 +units=m +no_defs## Warning in showSRID(uprojargs, format = "PROJ", multiline = "NO"): Discarded
## datum unknown in CRS definitionbasemap2 <- cc_location(loc = cbind(-1.5, 50.99), buffer = 2e5, base_url = fm_mapbox_styles("no borders"), max_tiles = 9)
## Preparing to download: 6 tiles at zoom = 7 from
## https://api.mapbox.com/styles/v1/michaelharper/ck9twyfhl0s3u1itk09h3fnah/tiles/512/## Warning in showSRID(uprojargs, format = "PROJ", multiline = "NO"): Discarded
## ellps unknown in CRS definition: +proj=merc +lon_0=0 +k=1 +x_0=0 +y_0=0
## +R=6378137 +units=m +no_defs
## Warning in showSRID(uprojargs, format = "PROJ", multiline = "NO"): Discarded
## datum unknown in CRS definitionbasemap3 <- cc_location(loc = cbind(-1.5, 50.99), buffer = 2e5, base_url = fm_mapbox_styles("no names"), max_tiles = 9)
## Preparing to download: 6 tiles at zoom = 7 from
## https://api.mapbox.com/styles/v1/michaelharper/ck9u0ihkg0vhg1jqfijqmrsp1/tiles/512/
## Warning in showSRID(uprojargs, format = "PROJ", multiline = "NO"): Discarded
## ellps unknown in CRS definition: +proj=merc +lon_0=0 +k=1 +x_0=0 +y_0=0
## +R=6378137 +units=m +no_defs
## Warning in showSRID(uprojargs, format = "PROJ", multiline = "NO"): Discarded
## datum unknown in CRS definitionThe results are presented below:
map1 <-
tm_shape(basemap1) +
tm_rgb() +
tm_layout(frame = FALSE)

map2 <-
tm_shape(basemap2) +
tm_rgb() +
tm_layout(frame = FALSE)

map3 <-
tm_shape(basemap3) +
tm_rgb() +
tm_layout(frame = FALSE)

tmap_arrange(map1, map2, map3)